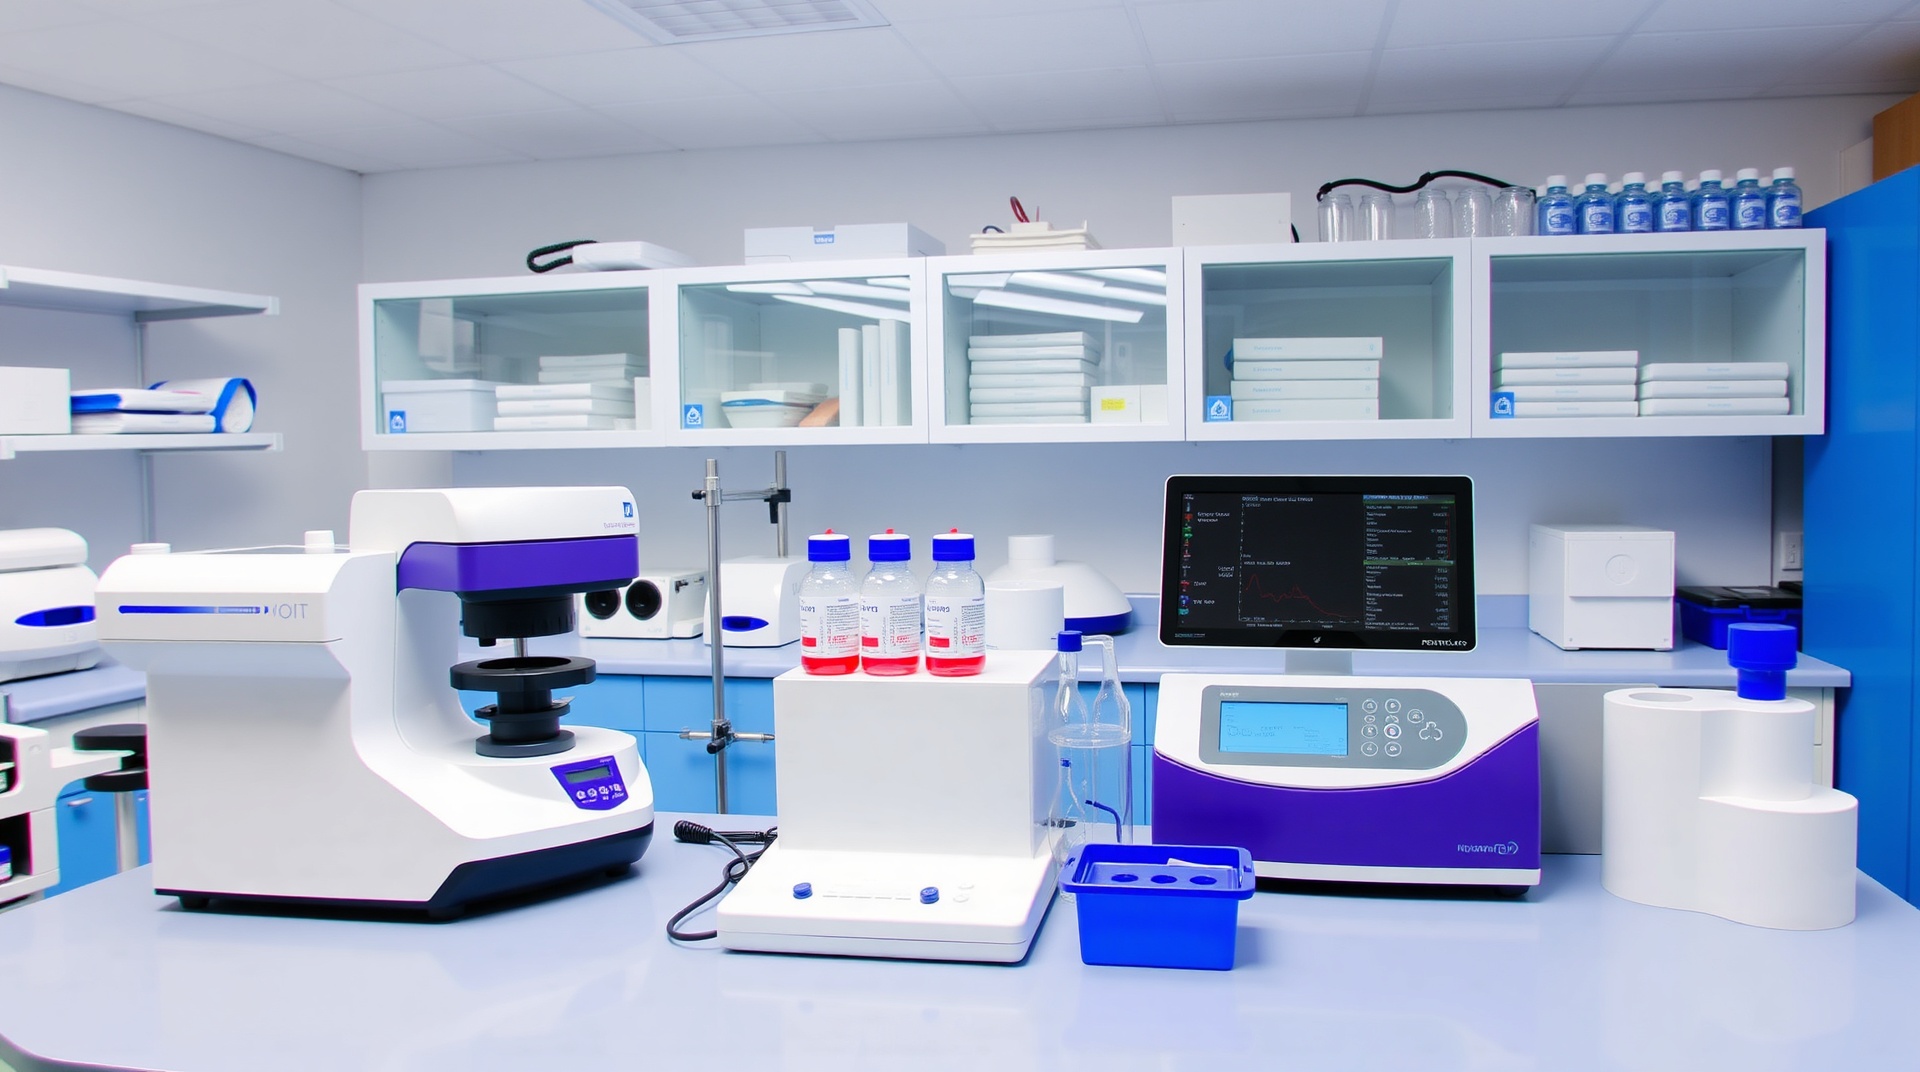
Protein ConcentrationCalculator
Calculate protein concentration using A280 absorbance or mass-based methods for lab and educational use.
How to Use
Method 1: A280 Absorbance
- 1Measure absorbance at 280nm using a UV-Vis spectrophotometer
- 2Enter the A280 value and dilution factor
- 3Input extinction coefficient (1.0 mg⁻¹mL⁻¹cm⁻¹ for unknown proteins)
- 4Confirm path length (usually 1 cm for standard cuvettes)
Method 2: Mass & Volume
- 1Enter the total protein mass in milligrams
- 2Enter the solution volume in milliliters
- 3Click "Calculate Protein Concentration"
Formula Explanation
Beer-Lambert Law (A280 Method)
A = ε × c × l
c = (A × Dilution Factor) / (ε × l)
Where A is absorbance, ε is extinction coefficient, c is concentration, and l is path length.
Mass/Volume Formula
Concentration = Mass (mg) / Volume (mL)
Direct calculation when protein mass and solution volume are known.
Example Calculation
A280 method:
A280 = 0.8, Dilution factor = 5, Extinction coefficient = 1.2, Path length = 1 cm
Concentration = (0.8 × 5) / (1.2 × 1) = 3.33 mg/mL
Mass/Volume method:
Mass = 25 mg, Volume = 10 mL
Concentration = 25 / 10 = 2.5 mg/mL
Understanding Protein Quantification
Protein concentration determination is essential in biochemistry and molecular biology research. Accurate quantification ensures proper experimental conditions for enzyme assays, structural studies, and protein characterization. The A280 method leverages the natural UV absorption of aromatic amino acids, providing a rapid, non-destructive approach to protein quantification.
The A280 measurement is based on the Beer-Lambert law, where absorbance is directly proportional to concentration. Tryptophan, tyrosine, and phenylalanine residues absorb strongly at 280nm, making this wavelength ideal for protein detection. However, the extinction coefficient varies significantly between proteins depending on their amino acid composition.
Compared to colorimetric methods like Bradford and BCA assays, A280 measurements are faster and preserve sample integrity. Bradford assays use Coomassie dye binding and are sensitive to protein structure, while BCA assays rely on copper reduction and can be affected by reducing agents. Each method has specific advantages depending on sample purity and experimental requirements.
Protein Quantification Methods Comparison
| Method | Speed | Sensitivity | Sample Required | Best For |
|---|---|---|---|---|
| A280 | Very Fast | Moderate | Non-destructive | Pure proteins |
| Bradford | Fast | High | Small volume | Crude samples |
| BCA | Moderate | Very High | Small volume | Low concentrations |
| Lowry | Slow | High | Moderate volume | Research standard |
Chart: Comparison of common protein quantification methods showing their relative strengths and ideal applications.
A280 Spectrophotometry Technique
Diagram: A280 spectrophotometry setup showing UV light at 280nm passing through protein sample for concentration measurement.
Key Components:
- • UV light source (280nm)
- • Sample cuvette (1cm path length)
- • Detector/photometer
- • Reference blank
Measurement Process:
- • Blank with buffer solution
- • Measure sample absorbance
- • Apply Beer-Lambert law
- • Calculate concentration
Applications in Protein Research
Protein concentration measurement is fundamental to biochemical research, from enzyme kinetics studies to structural biology preparations. Accurate quantification ensures reproducible results in protein purification, crystallization, and functional assays. The A280 method is particularly valuable for monitoring protein elution during chromatography and assessing purification efficiency.
Modern proteomic workflows require precise concentration measurements for downstream applications including mass spectrometry, Western blotting, and enzymatic assays. The choice of quantification method depends on sample purity, concentration range, and experimental requirements. A280 measurements excel in real-time monitoring applications where sample preservation is critical.
For comprehensive molecular biology calculations, explore our related tools including DNA concentration calculator and DNA ligation calculator for complete laboratory workflow support.
Calculate Protein Concentration
User Reviews
Based on 3 reviews
Dr. Sarah Johnson
1 week agoExcellent tool for protein quantification! The A280 method works perfectly with our lab protocols. Very accurate and saves time.
Mark Rodriguez
2 weeks agoGreat calculator for biochemistry work. The dual calculation modes are helpful for different experimental setups.
Dr. Emily Chen
1 month agoPerfect for protein purification workflow. The extinction coefficient input is particularly useful for specific proteins.
Frequently Asked Questions
Need More Biology Tools?
Explore our comprehensive collection of biology calculators
Explore More Biology Tools